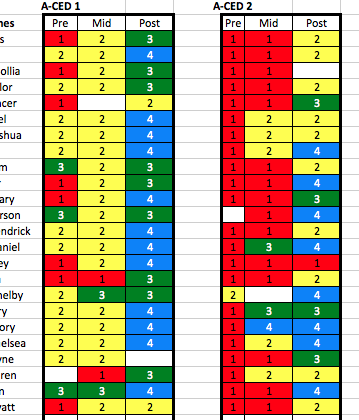
I’ve been using the data teams process in my classroom for a few years now. When I began I had no training, I had to do a lot of research and talk to a lot of people who used the process. The forms seemed extremely long and didn’t give me the graphical representation I was looking for. Over the past three years I’ve developed and tweaked a template that has made data collection more than just a “collection.” This template shows growth for individuals, whole class, and combined classes. I use a 4, 3, 2, 1 system for proficient to not likely to reach proficiency (terms from many data teams references.)
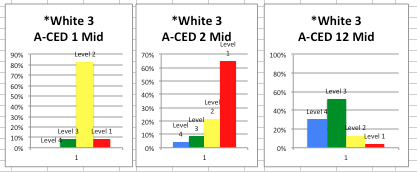
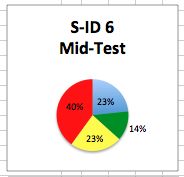
When you enter the number, it color codes for you, builds a graph for the class, totals all classes and builds a graph for the class totals.
The last tab of the spreadsheet is for misconceptions, strengths and learning strategies. This tab is the most important because data teams is a useless tool unless you use it to guide your instruction.
I’ve included a link to this tool for personal use. I hope it makes the use of data in your classroom a little easier for you.